The Buildings app allows the user to access information about the performance of UBC’s building stock. This includes key performance metrics and building utility data about a specific building, or measurements of the building stock as a whole. Each tab allows for access to slightly different information.
The Building Summary tab gives snapshots of building data, including basic information such as construction year or gross area. Selecting a building will bring up a performance summary for the building. The display consists of the following elements:
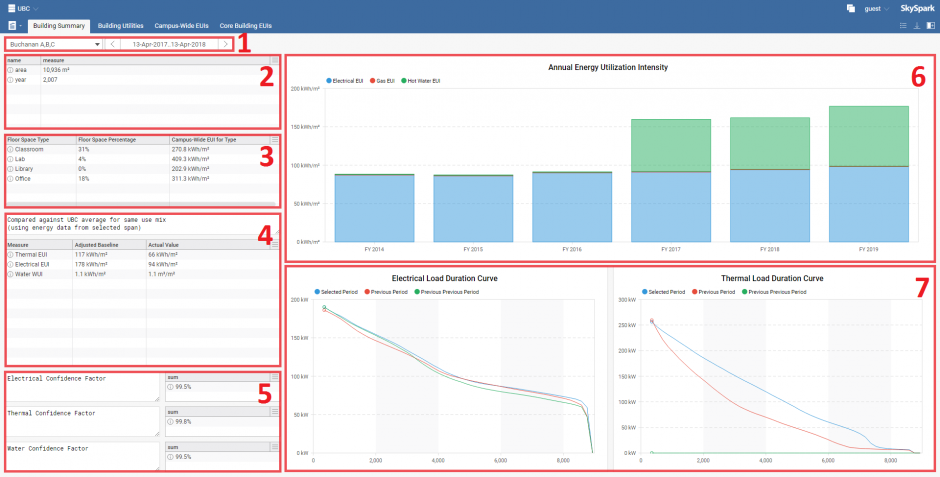
- Building and time span selectors.
- Basic information about the building; construction year and gross area given in square meters.
- Breakdown of the building’s space use, as specified by UBC Campus & Community Planning, and the UBC-wide average total EUI for each use type.
- Energy and Water Use Intensities for the selected building and time span are given on the left, and are compared against a theoretical average building with the same floor space breakdown.
- Confidence factors give an indicator of data quality for the selected time span. A data point is expected for every 15 minutes of the selected span, but some may be unavailable due to meter errors or communication failures. Some dropped data (a confidence value less than 100%) is to be expected.
- The Energy Use Intensity given for the current fiscal year (linearly forecasted) as well as up to the previous five fiscal years if available.
- Electrical and thermal load duration curves constructed for the selected time span, as well as the two previous time periods of the same length.
The Building Utilities tab allows for viewing of a single building’s utility data all on one page. As with the Building Summary tab, a building and time span can be chosen using the selectors. Additionally, individual utilities (electrical, thermal, and water) can be explicitly included or excluded from display. By default, an automatic data rollup will be chosen. This means that daily data will be shown for a one-year display; hourly data for a month’s display, and so on. This rollup can be overridden and another interval selected, but note that SkySpark can only display a maximum of 10,000 data points at a time. Recall that data can be downloaded using the export button near the top right.
On the Campus-Wide EUIs tab, it is possible to see how EUIs at UBC have been trending over a long period of time. Each individual day’s EUI (or WUI) value is calculated based on the previous 365 days’ energy and water consumption.
The Campus EUI Summary Table and Ancillary Buildings EUIs tabs display buildings’ EUIs for the selected time span. Additional information for any column, including exact values, can be found by clicking on the column in question.
Finally, the Building List tab simply lists the buildings which have some amount of data integrated into SkySpark.